The Average Instagram Engagement Rate Across Industries Benchmarks 2019 to 2023:
Social Media Insights | Global
We like to keep you updated all the time with the latest updates about social media benchmarks, let’s go through this Instagram benchmark in 2019 to 2023.
Instagram Posts VS. Engagement Rate Across Industries in 2019:
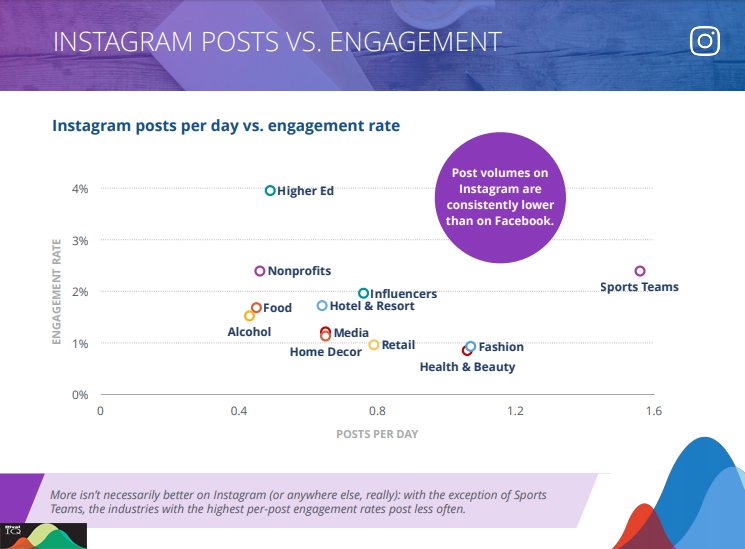
A Figure Shows Instagram Posts VS. Engagement, 2019.
- The Higher Education industry is ranked as the industry with the highest Instagram engagement rate of 3.96%, and Instagram posts per day rate of 0.49.
- Sports teams’ industries come next with an Instagram engagement rate of 2.40%, and Instagram posts per day rate of 1.56.
Instagram Average Posts per Day in 2019:
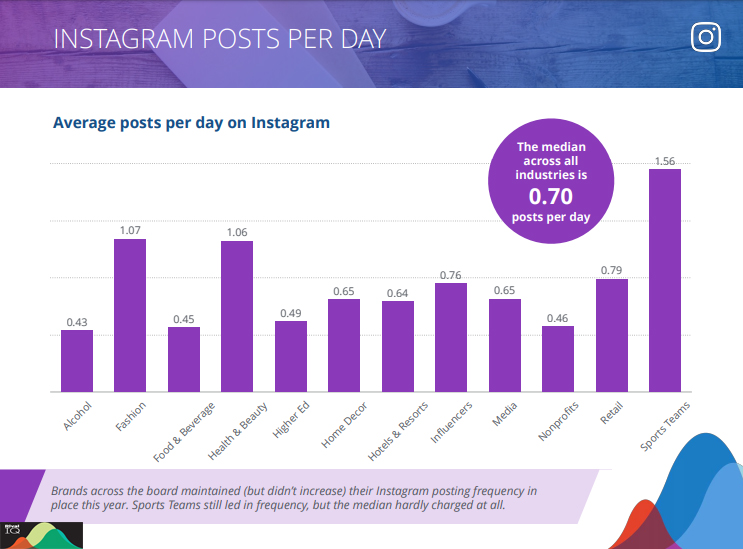
A Graph Shows The Average Posts Per Day on Instagram Across Industries—2019 Data
- The sports teams are ranked in the industry with the highest average posts per day on Instagram with a rate of 1.56 posts.
- Fashion industries come next with an average of posts per day on Instagram with a rate of 1.07 posts.
- The health and beauty industry is also listed with an average of posts per day rated with 1.06 posts.
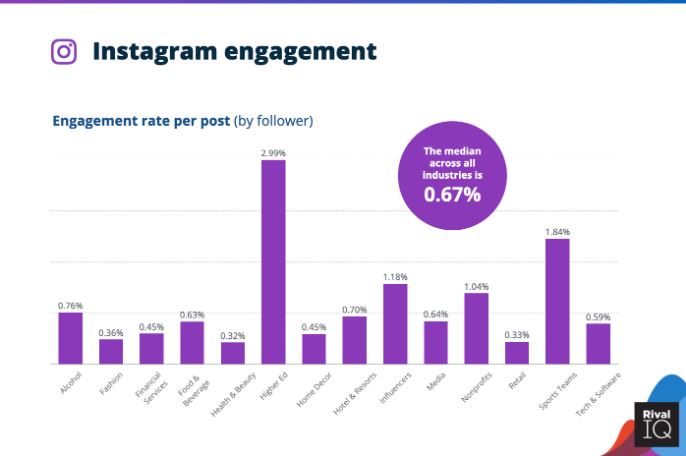
According to the chart, this is the Instagram engagement rate per post (by follower), and the median across all industries is 0.67%.
And the following chart shows Instagram activity:
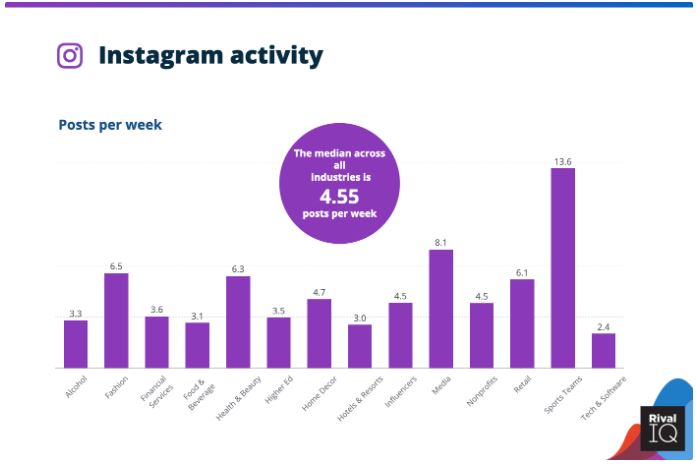
As shown, the median across all industries is 4.55 posts per week. The median posting frequency across all industries increased about 25% this year on Instagram.
And the following graph shows Instagram posts VS. engagement across all industries.
Instagram Engagement Rate Across Industries 2020 Vs. 2019:
The most common post on Instagram is an image post. When posting images, it’s important to share a variety of photos. The variety will show that the brand is diverse and engaging followers in different ways. It’s also important to remember that Instagram users are looking for genuine posts from brands, not blatant advertisements.
The Average Instagram Engagement Rate in 2020:
It is obvious that Instagram engagement rates decreased this year unlike last year as shown in the chart below.
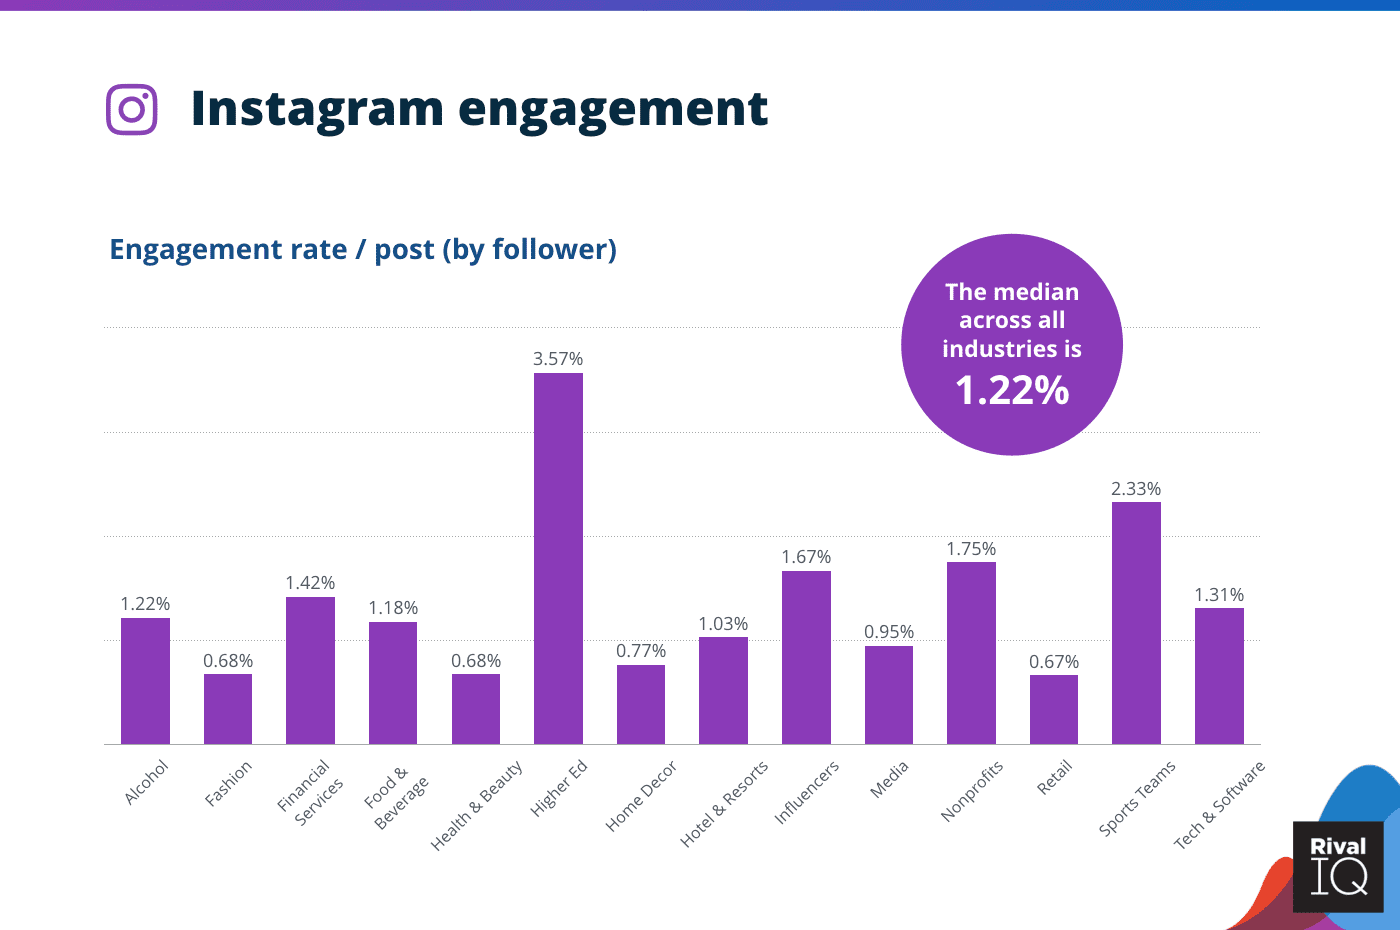
A Graph Shows the Average Instagram Engagement Rate Per Post Across Industries —2020 Data
- As shown the average Instagram engagement rate across all industries has reached 1.22%.
- On the other hand, the median posting frequency on Instagram is 0.62 posts per day. it declined by just 5%.
- However, the Higher Education engagement is 3.57% and it is the winner across all industries.
Create a valuable marketing list now with Get Response and get great results!
The Average Instagram Engagement Rate in 2019:
Comparing the Instagram engagement rate 2020 to last year’s engagement rate we can see that:
- The higher Ed industries are ranked as the top industries with an average engagement rate per post on Instagram of 3.96%.
- Sports teams and non-profit industries come next with an average engagement rate per post on Instagram of 2.40%.
- Influencers are also listed with an average engagement rate per post on Instagram of 1.97%.
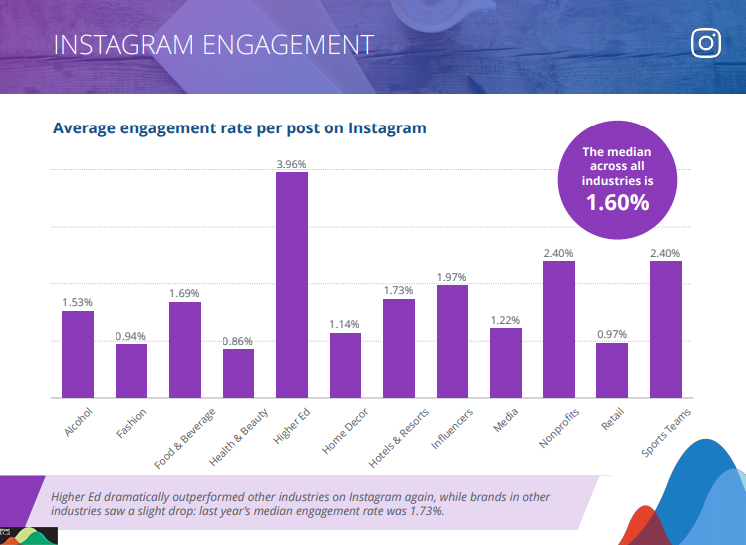
A Graph Shows The Average Engagement Rate Per Post on Instagram by Industries—2019 Data
Related Post: The Average Facebook Engagement Rate Across Industries Benchmarks 2020 Vs. 2019
The Average Posts Per Day on Instagram Across Industries in 2020 VS 2019:
Instagram Average Posts per Day in 2020:
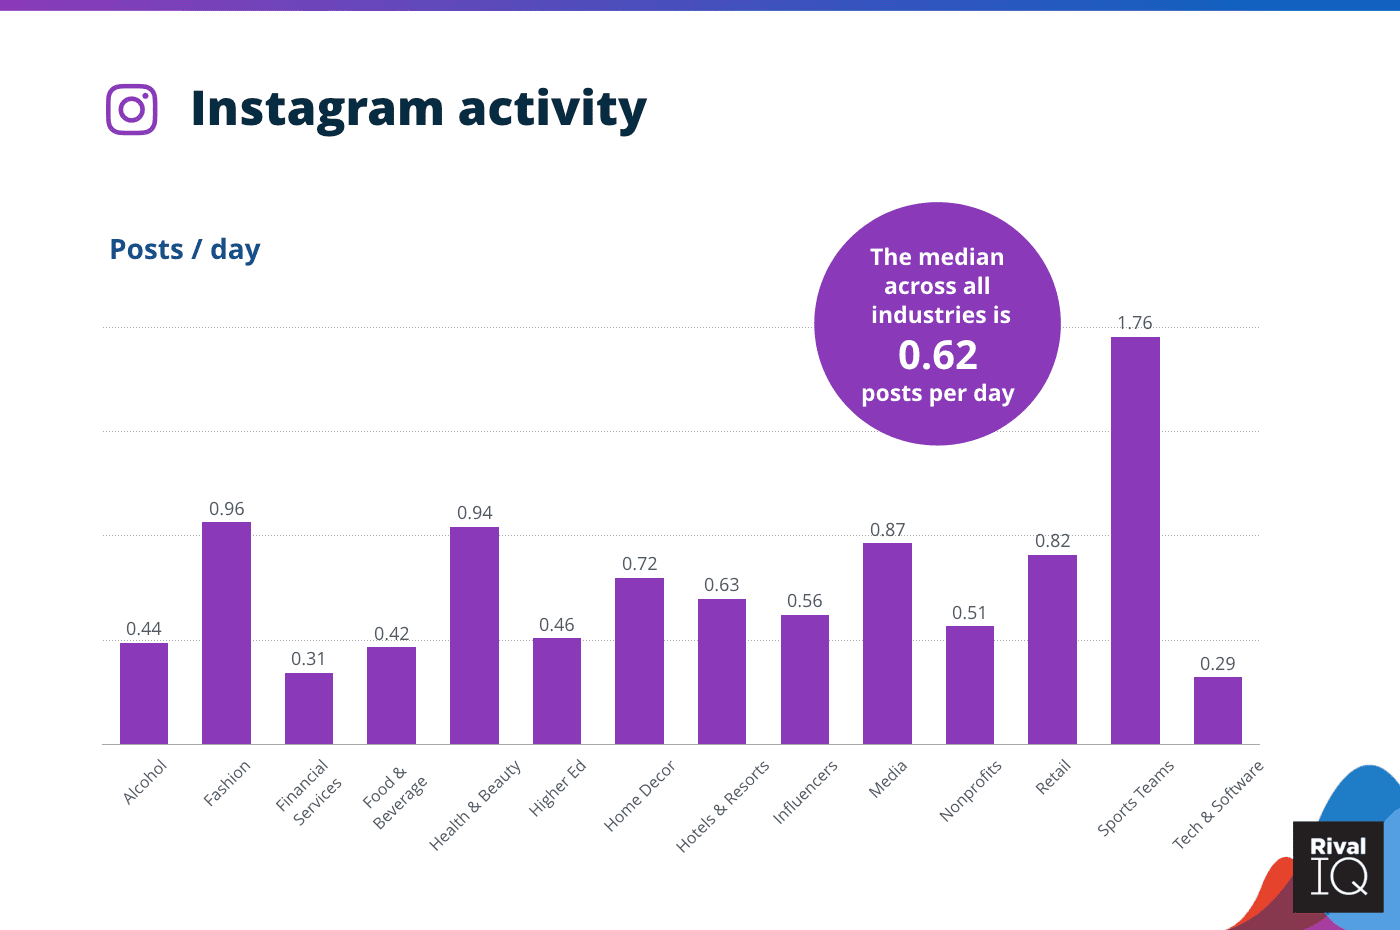
A Figure Shows the Average Posts per Day on Instagram Across Industries— 2020 Data
- Sports Teams’ industries continue to rank in the first place with the highest average posts per day on Instagram with a rate of 1.76.
- However, the median across all industries has decreased to 0.62 posts per day.
It’s an important step to build unique profiles for your audience, therefore Adobe Audience Manager helps you get a complete view of your audience by combining all data sources in one place.
Instagram Posts VS. Engagement Rate Across Industries 2020 Vs. 2019:
The Average Instagram Posts Vs. Engagement Rate Across Industries in 2020:
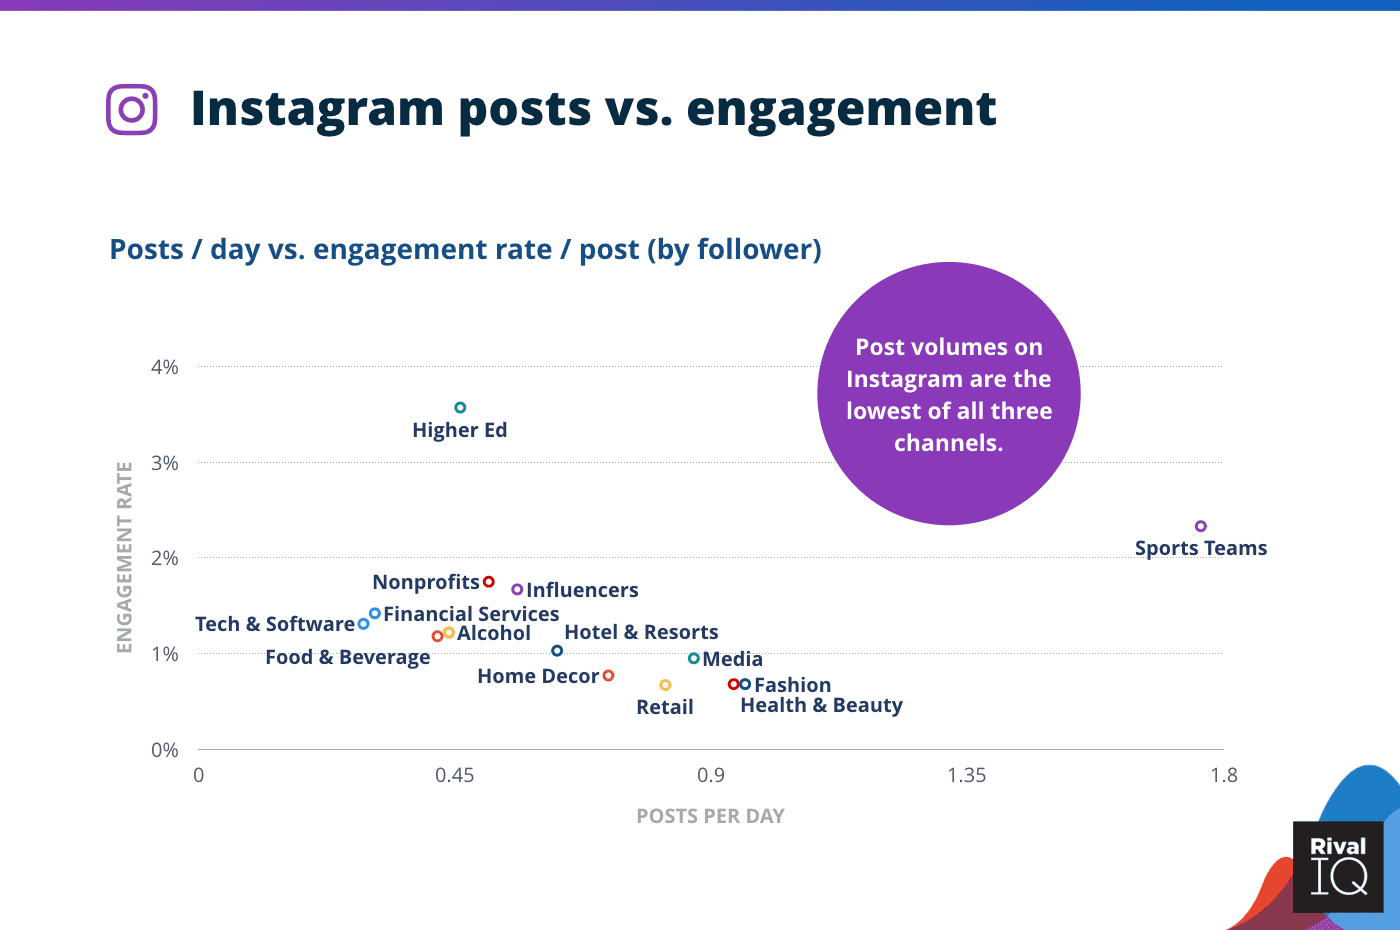
A Figure Shows the Relation Between the Average Facebook Posts and Engagement Rate Across Industries—2020 Data
- The Higher Education industry is still ranked as the top industry with a 4% engagement rate and posts per day rate of 0.45.
- Sports teams’ industries come in second place with an Instagram engagement rate of 2.40%, and Instagram posts per day rate of 1.8.
Instagram Engagement Rate 2022, across Industries:
This might sound a little bit shocking but Instagram engagement rates fell by about 30% this year, however, the good side is, that Instagram engagement rates are still way higher than Twitter or Facebook.
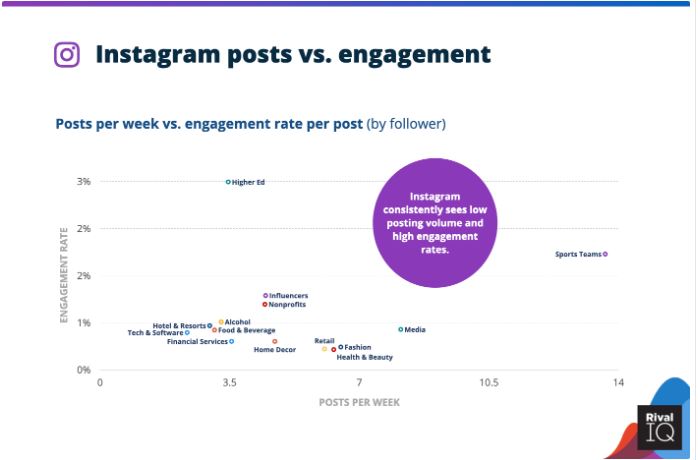 Clearly, Higher Ed was the clear engagement winner on Instagram even though it is below-median posting frequency, suggesting more isn’t always better on Instagram (even though second-place Sports Teams might beg to differ).
It is worth saying that the average Instagram engagement rate in 2022 is 4.7%, but it is always better to stay higher than average.
We can’t stop here, can we? continue reading if you’d like to know the Instagram engagement rate benchmark across industries in 2023, ALL IN DETAILS!
Instagram Engagement Rate in 2019 VS 2022:
Rival IQ has released its 2020 Social Media Benchmarks Report includes everything you need to know to benchmark your social media success on Instagram, Facebook, and Twitter against your competitors across these.
Focusing on Instagram, it’s clear that Instagram isn’t just for personal use only anymore. It’s now a global platform that allows brands to humanize their content, recruit new talent, showcase products, and inspire their audience.
It is important to consider the Instagram engagement rate while working on Instagram marketing strategy nowadays.
Let’s dive into details and take a look at Instagram engagement in 2020 versus 2019…
Related Tool: Fanpage Karma: The Best Tool for Social Media Analytics and Monitoring.
Instagram Engagement Rate of 2023
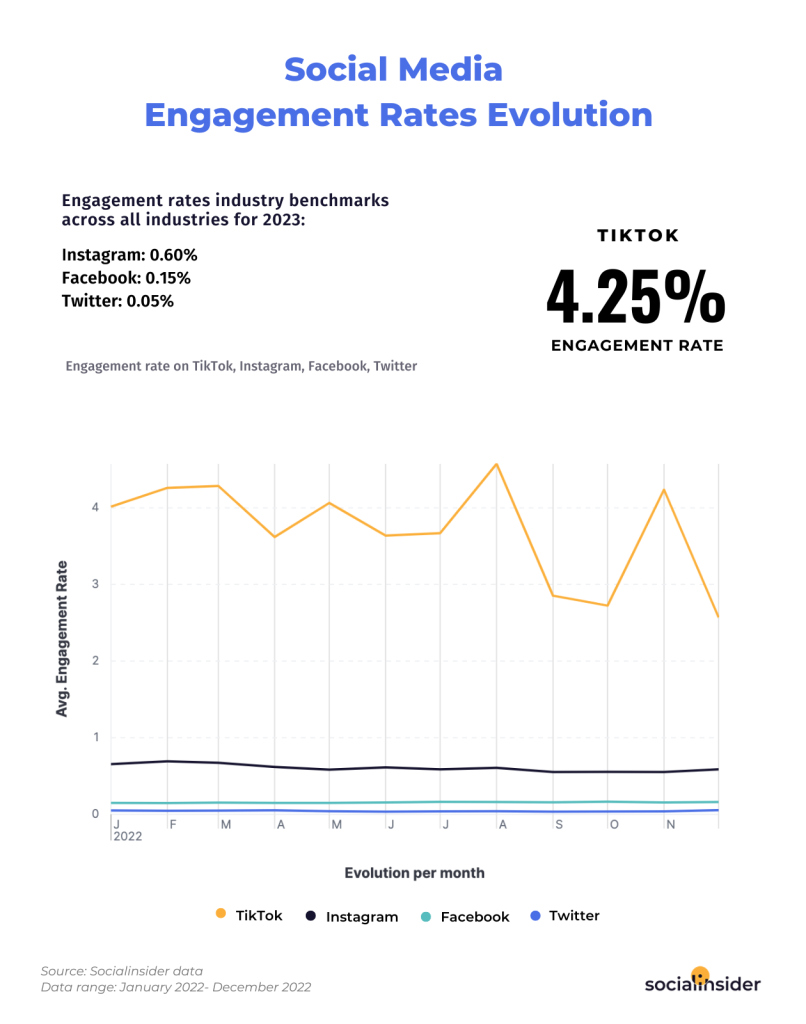
This figure shows the Instagram Engagement Rate of 2023 and general social media rates
- Tiktok: Ranks the highest with a rank of 4.25%
- Instagram: Ranks the second highest with a percentage of 0.60%
- Facebook: Ranks the third most used with a percentage of 0.15&
- Twitter: Ranks the lowest with a percentage of 0.05%
Instagram Engagement Rate 2023, Across Industries:
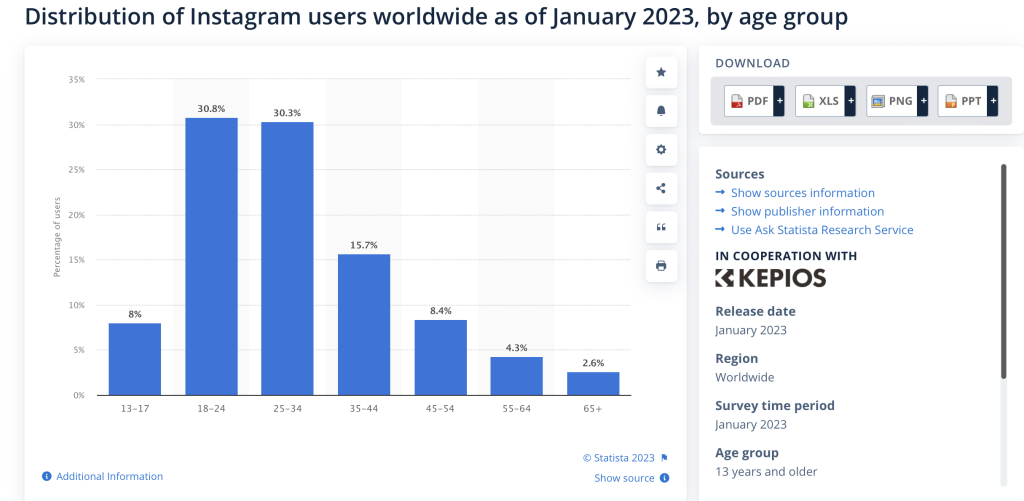
- This graph shows the engagement rate and age group of Instagram users in 2023:
- Ages of 13-17: makeup 8% of users
- Ages of 18-24: makeup 30.8% of users
- Ages of 25-34: makeup 30.3%
- Ages 35-44: makeup 15.7%
- Ages 45-54: makeup 8.4% (as low as ages 13-17)
- Ages 55-64% make up 4.3% of users
- Finally, the age group of 65+ makes up only 2.6%
In Conclusion, young ages of 13-17 and older ages of 55 to 65+ make up only 6% of users, so they are the smaller age group of users, and most users of Instagram are 18 to 34.
