Shopify’s State of eCommerce Report, 2019 | Shopify
E-Commerce & Retail | Global
Shopify’s marketplace for buying and selling e-commerce businesses built by Shopify merchants. Over the last year, the retail industry has experienced tremendous disruption and with these changes, both merchants and their customers have found new opportunities. In its first Shopify’s state of commerce report, Shopify found that online storefronts represent over 80% of sales and over 62 million buyers have bought from the same store twice. Shopify has continued its global growth with more than 820,000 merchants on the platform in over 175 countries, with new insights on what’s driving commerce and buying behavior around the world.
The workarounds, apps, or third-party gateways that enable businesses to sell in multiple currencies aren’t always reliable. Your eCommerce platform should provide a solution. Shopify Plus offers a multi-currency solution that allows buyers to check out in their preferred currency, and merchants to get paid in their local currency. The solution you rely on should automatically convert prices based on location and up-to-date FX rates. Prices, taxes, gift cards, discounts, shipping, and refunds should be automatically converted to customers’ local currency, from landing page to checkout.
The Key Findings of “Shopify’s State of eCommerce, 2019” Report:
- 31% of surveyed North American savvy searchers indicated that their main buying motivation is “Finding it”.
- 28% of surveyed North American trend trackers reported that their attitude to marketing and personalization is indifferent to marketing engagement.
- Last year there is an average of buyers that they made purchases from the same store with a rate of 3.8 times.
- 73% of surveyed North American respondents agree that “once they find a product or brand they like, they stick with it.”
- The number of buyers buying from Shopify merchants is 218 million in 2018, compared to 163 million in 2017.
- Consumers in the US are buying about nearly twice as much as 6 items compared to other countries that they buy from 2 to 3 items.
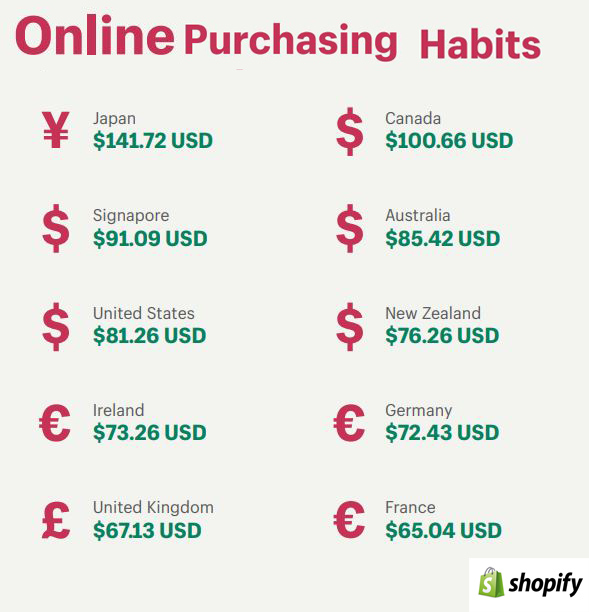
- Consumers in Japan spend the most on average $141.72 USD per transaction compared to the other countries.
- 30% of surveyed merchants reported that marketing is their biggest challenge followed by brand awareness with a rate of 22%.
- From 2018 to 2019, merchants using Shopify POS increased by 14%.

A Figure Shows The Average Spending Per Transaction, 2019.
The Content of “Shopify’s State of eCommerce, 2019” Report:
- Methodology.
- North American Consumer Buying Behavior.
- The Battle for Brand Loyalty.
- Seasonal Shopping.
- Online Purchasing Habits.
- Shop Around The Clock.
- Mobile, Desktop or Tablet?
- Marketing Gap For Business Owners.
- Retail Reborn.
- Products By Country.
Number of Pages:
- 23 Pages.
Pricing:
- Free.
Methodology:
Data is driven by a survey of the global sales data on Shopify from April 2018 to April 2019. An online global survey of 3,832 Shopify merchants in March 2019. This is quantitative and qualitative research on consumers in Canada and the United States in December 2018, including interviews and an online survey of 2,653 consumers.


