2020 Social Media Industry Benchmark Report | Rival IQ
Social Media Insights | Global
It’s the time to keep your eyes and ears all open! Rival IQ has released its Social Media Benchmarks Report of 2020…
During this new phase of marketing; “competitive analysis”, Every marketer should be keen on knowing his competitors in order to understand their strengths and weak points in relation to his business which helps to create a suitable strategy.
So, the 2020 Rival IQ Social Media Benchmarks Report covered with everything you need to know to measure your social media success against your competitors on social media platforms such as Facebook, Twitter, and Instagram across 14 major industries.
Without further ado, here are the top-line findings…
Check: 2019 Social Media Benchmark Report | Rival IQ
Social Media Benchmarks 2020 — Key Takeaways:
- Instagram engagement rates decreased, standing still on Facebook and Twitter. Even though, Instagram is the world’s most engaging social media channel it became less engaging this year, unlike Facebook and Twitter which managed to maintain the engagement levels from 2019.
- Posting Frequency is down as brands are posting a little less often on every channel.
- Giveaways play the main role. Brands should take advantage of that and seek out opportunities to engage with their followers.
- Carousels are key for Instagram as they lead to high Instagram engagement across all industries and very important to brands to consider combine photos into carousels.
Social Media Benchmarks 2020 Across 14 Industries
Facebook Engagement Rate 2020:
- The all-industry Facebook median engagement rate stayed flat this year. It was 0.09% across all industries.
- Industries decreased their posting frequency on Facebook by about 14% this year.
- Top Facebook performer Sports Teams posted 2x the median posts per day, but Media’s performance shows that more frequent isn’t always better.
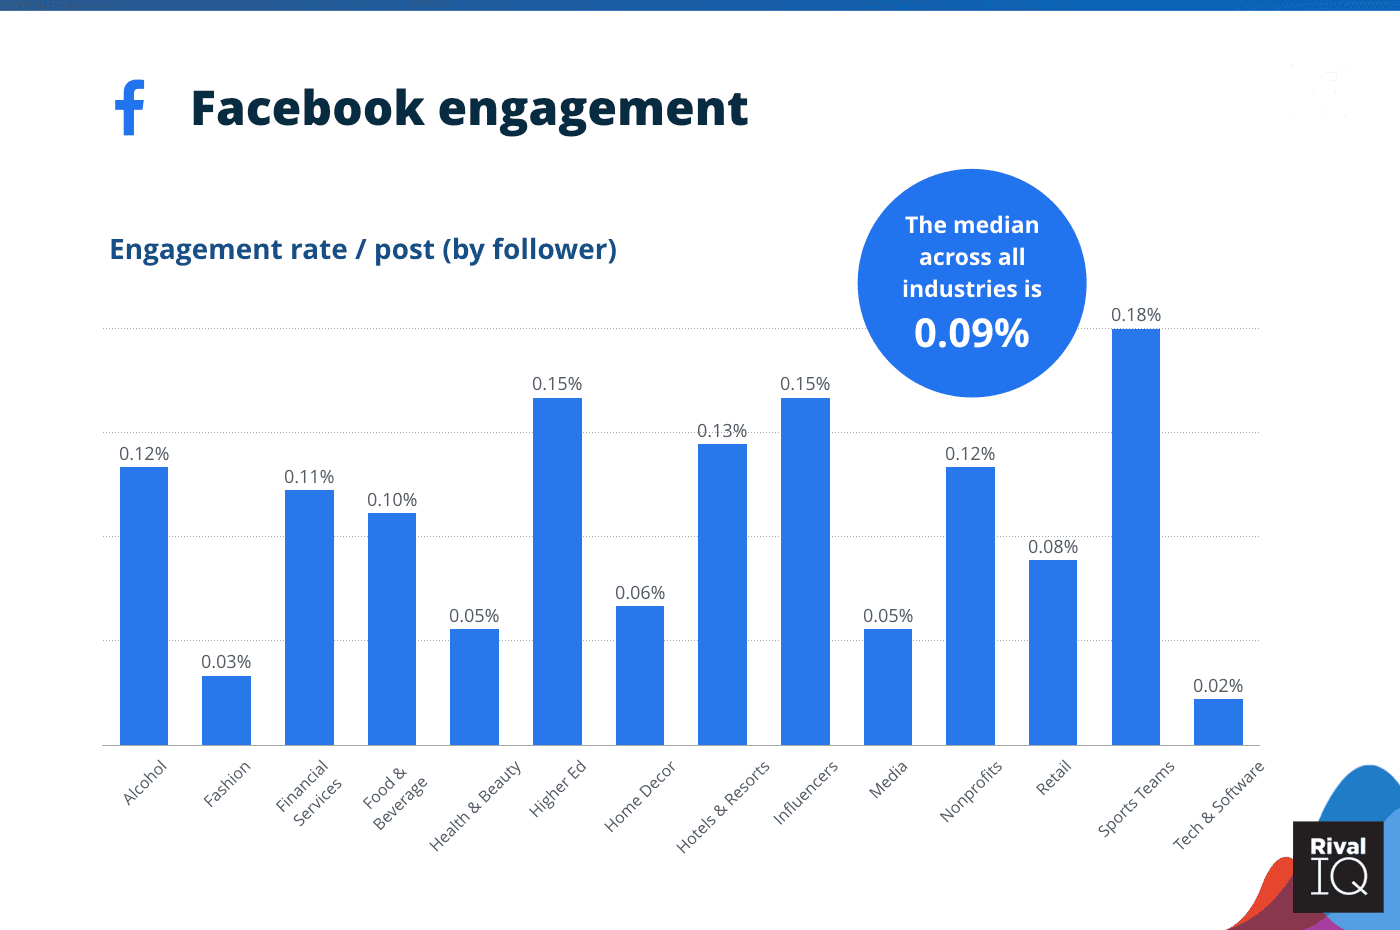
Facebook Engagement Rate 2020 Across 14 Industries
Instagram Engagement Rate 2020:
- The average Instagram engagement rate across all industries is 1.22%.
- The median posting frequency on Instagram is 0.62 posts per day. It declined by just 5%.
- The winner on clear engagement on Instagram is Higher Education despite the below posting frequency.
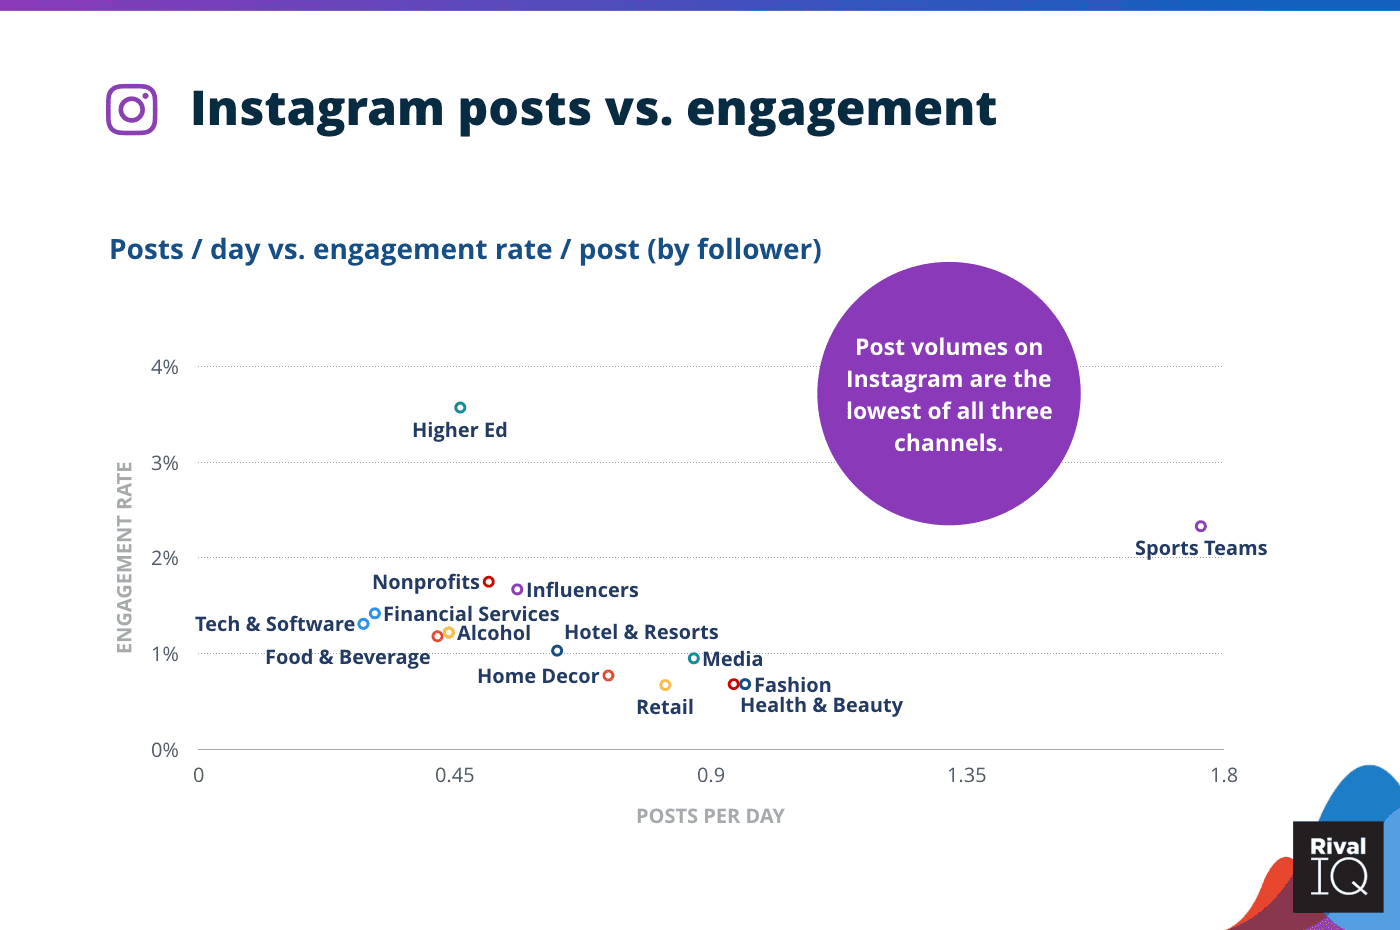
Instagram Posts Per Day Vs. Engagement Rate Across 14 Industries
Related Report: The 2020 Instagram Stories Benchmark Report | Rival IQ
Twitter Engagement Rate 2020:
- As for Twitter, its engagement remained sustainable for the third year in a row. Higher education and Alcohol industries are staying ahead.
- The median tweeting frequency across all industries is 0.77 tweets per day.
- Tweeting frequency declined by about 10% this year.
- High Education, Alcohol, and Financial Services managed wins on Twitter without bombing their followers with above-median tweets per day.
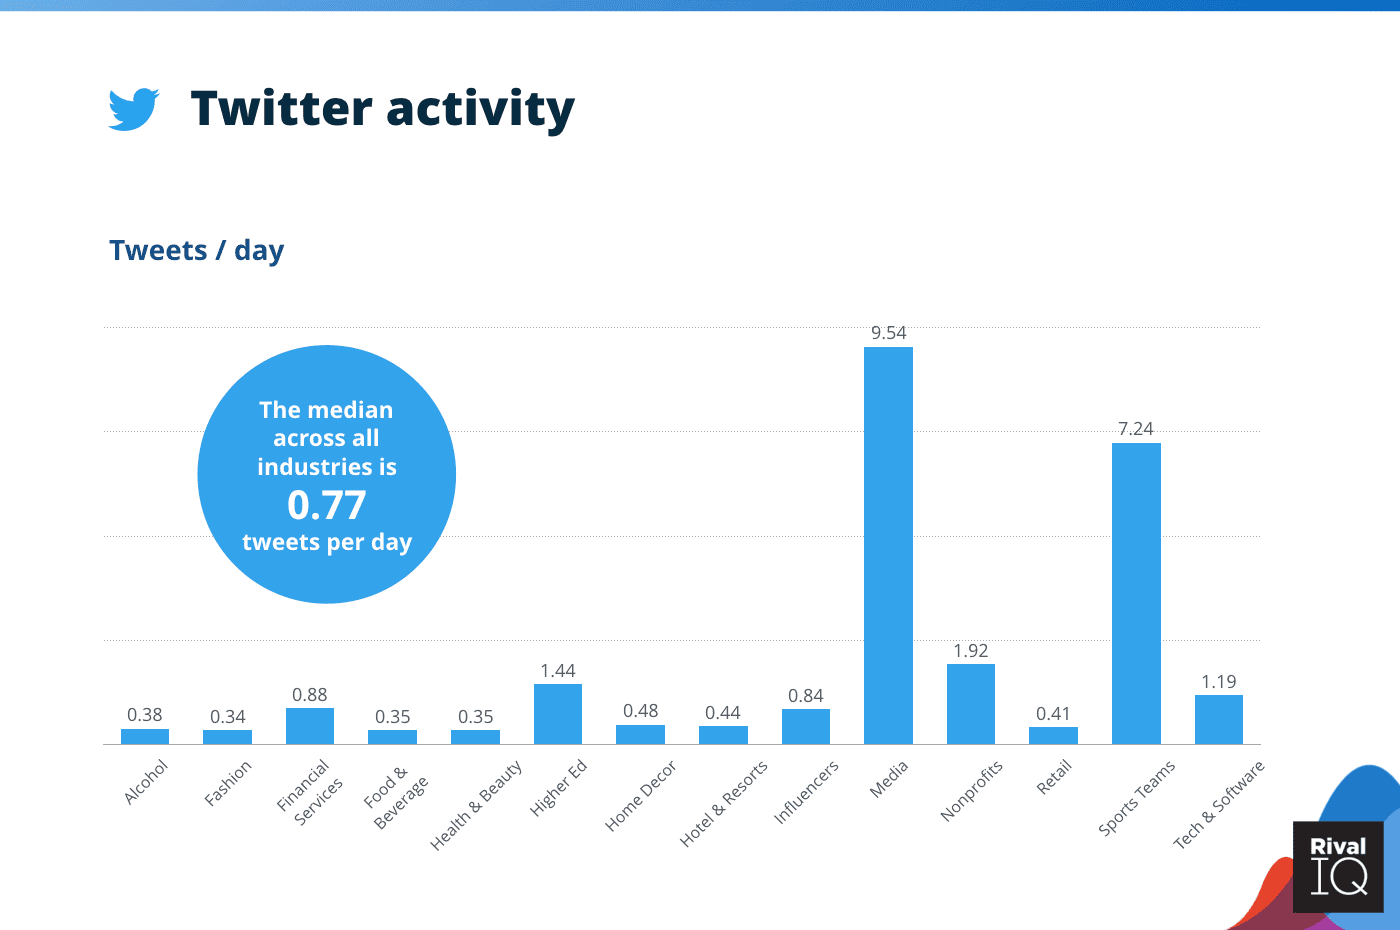
Twitter Tweets Per Day 2020 Across All Industries
Content of the “Social Media Industry Benchmark 2020 Report”:
- Introduction
- Key takeaways
- Methodology
- The Benchmarks
- Why do we benchmark?
- The metrics that matter
- Average Facebook engagement rate
- Facebook activity
- Facebook posts vs. engagement benchmarks
- Average Instagram engagement rate
- Instagram activity
- Instagram posts vs. engagement benchmarks
- Average Twitter engagement rate
- Twitter activity
- Twitter tweets vs. engagement
- Social Media Benchmarks by Industry 2020
- Industry Snapshot: Alcohol
- Industry Snapshot: Fashion
- Industry Snapshot: Financial Services
- Industry Snapshot: Food & Beverage
- Industry Snapshot: Health & Beauty
- Industry Snapshot: Higher Ed
- Industry Snapshot: Home Decor
- Industry Snapshot: Hotels & Resorts
- Industry Snapshot: Influencers
- Industry Snapshot: Media
- Industry Snapshot: Nonprofits
- Industry Snapshot: Retail
- Industry Snapshot: Sports Teams
- Industry Snapshot: Tech & Software
- About Rival IQ
Number of Pages:
- 132 Pages
Pricing:
- Free
Methodology:
Rival IQ analyzed engagement rates, posting frequency, post types, and hashtags on the top three social channels for brands; Facebook, Instagram, and Twitter.
Rival IQ defines engagement as measurable interaction on social media posts, including likes, comments, favorites, retweets, shares, replies, and reactions. The engagement rate is calculated based on all these interactions divided by total follower count.
Within this report, Rival IQ provides a representative sample of national and international companies in each industry by selecting 150 companies at random from each industry from our database of over 180,000 companies.
Companies selected had an active presence on Facebook, Instagram, and Twitter as of January 2019, and had Facebook fan counts between 25,000 and 1,000,000 and minimum Instagram and Twitter followers of 1,000 as of the same date.
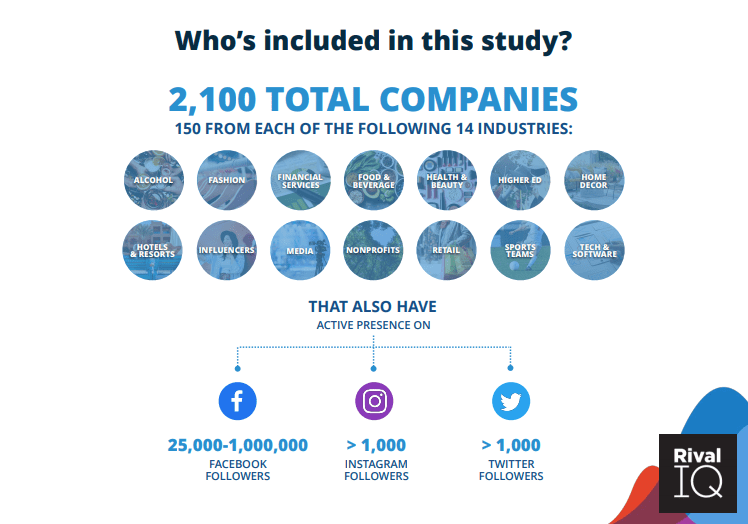
Social Media Benchmarks 2020 — Methodology
Rival IQ
 Rival IQ[/caption]
Benefits:
- Increase social engagement.
- Break through the noise with fast, impactful analytics about how your social media efforts are received by your audience.
- Know exactly which posts get the best response, and compare them to other posts including your competition.
- Customize, schedule, and export reports that give you key metrics to drive engagement and justify your social media campaigns.
- Track the competition.
- Conduct competitive analysis in minutes. See how quickly your competitors are gaining followers, how often they post, their average engagement rate, and what their most successful posts look like.
- Gain insight into competitor strategy by spotting boosted content.
- Use this knowledge to react quickly, imitate successful posts, or secure additional budget to keep pace.
- Discover new content ideas.
- Listen, spot trends, and give your audi
- ence what they need.
- Find inspiration for your own social campaigns.
- Using easy-to-access data, recognize your own top content and expand its use.
- Learn which hashtags perform in your landscape to engage and grow your audience.
- See the hashtags your competitors use and learn how well they’re working.
- Social media analytics that makes you look good.
 Rival IQ[/caption]
Services & Features:
- Social media and SEO benchmarking
- Boosted Post Detection
- Google Data Studio Connector
- API Access
Pricing:
- DRIVE - $199/mo (Track 10 companies/ Each 10 additional companies: $100/mo)
- ENGAGE - $349/mo (Track 15 companies /Each 10 additional companies: $100/mo)
- ENGAGE PRO - $499/mo (Track 20 companies Each 10 additional companies: $100/mo)
