The 2020 Instagram Stories Benchmark Report | Rival IQ
Social Media Insights | Global
Rival IQ analyzed over 29,000 Instagram stories and over 145k frames posted between June-October 2019 to bring you Instagram Benchmarks insights for your 2020 social marketing strategy.
The Instagram Benchmarks Report answeres there questions:
- How do you find your Instagram benchmarks stats?
- How frequently should you be posting Stories?
- Should you be posting videos, images, or both in my Instagram Stories?
- What kind of Stories engagement (taps, replies, and exits) should you expect?
- How might your Instagram engagement rate benchmark change if you posted more or grew your followers?
Related Report: 2019 Social Media Benchmark Report | Rival IQ
Let’s take a look at the key findings and takeaways on Instagram benchmarks 2020…
How Many Instagram Stories Should You Post Per Month?
- The average brand is posting Instagram Stories 9 times per month.
- The top 25% of most active brands publish Stories on Instagram at least 14 times a month.
- The least active 25% of brands publish just over 1 Story per week.
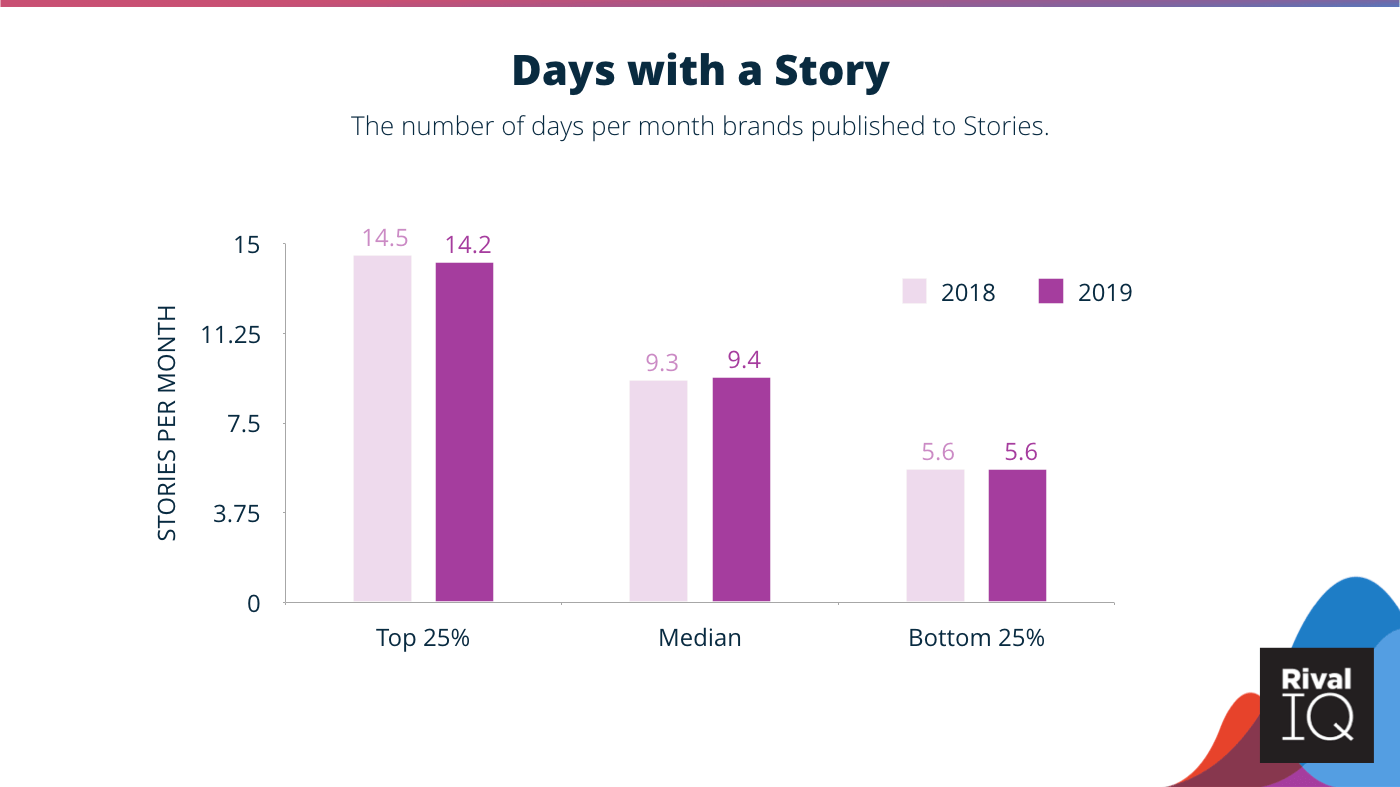
The Perfect Number of Instagram Stories to Post Monthly
How Many Instagram Frames Should You Post Per Day?
- About 28% of Story activity comprises days with only one frame.
- 1-3 frames account for about 54% of brand activity.
- Only 24% of Stories have 7 or more frames.
But keep in mind that the more frames you publish, the lower the retention rate.
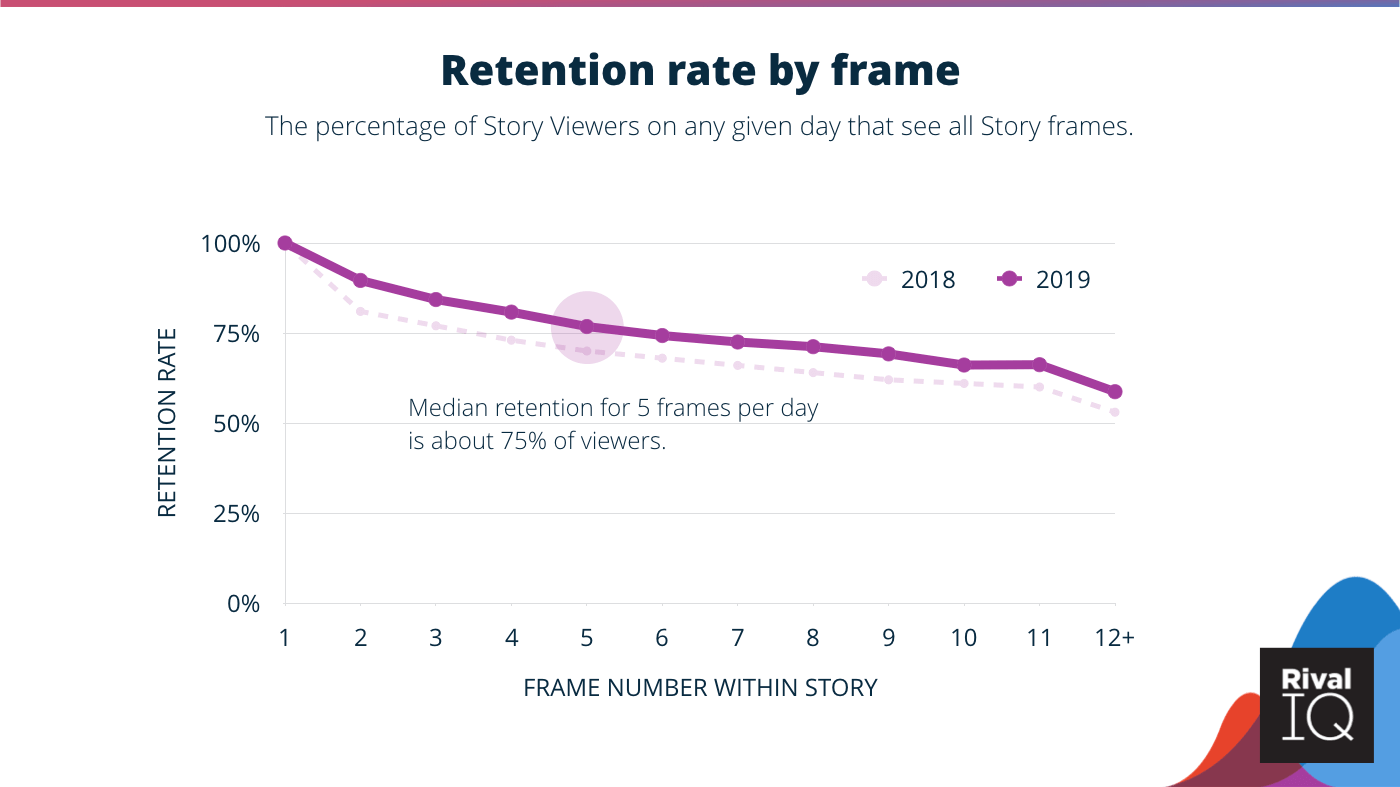
Instagram Retention Rate by Frame 2020
The Content of “The 2020 Instagram Stories Benchmark Report“:
- Introduction
- Key findings and takeaways
- Days with a Story: The number of days per month brands published a Story.
- Frames Per Day: The number of individual photos or video frames posted to your Story within a 24-hour period.
- Retention Rate: The percentage of Story Viewers on any given day that sees all frames.
- Reach Rate: Your Story Viewers on any given day divided by follower count, expressed as a percentage.
- Post Reach Rate: The reach of a post expressed as a percentage of followers.
- Tap-forward Rate: The percentage of Story impressions that have a tap forward.
- Tap-back Rate: The percentage of Story impressions with a tap backward.
- Reply Rate: The percentage of Story Viewers that replied to the Story on any given day.
- Exit Rate: The percentage of impressions that exit your Stories by swiping right, swiping down, or closing Stories.
Number of Pages:
- 39 Pages
Pricing:
- Free
Methodology:
Rival IQ analyzed over 29k stories and 145k frames from 550 brands on Instagram to bring you the most comprehensive look at Stories’ performance and full insights into Instagram benchmarks 2020.
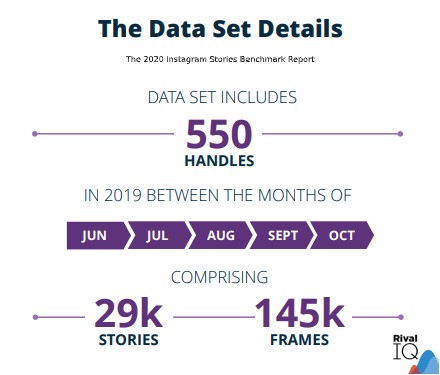
The Rival IQ 2020 Instagram Stories Benchmark Report – More About the Collected and Analyzed Data


