B2C Retail Benchmark Report, Q1 2020 | Episerver
E-Commerce & Retail | Global
Online retail has been successful in 2019, as consumers spent $9.4 billion on Cyber Monday alone. A number like this should not be surprising because the percentage of consumers shopping online every week is 26%.
However, in 2020, retailers should take credit for delivering strong eCommerce sales while bearing in mind broader economic trends that might make earning consumer dollars more difficult in the future.
The Episerver’s B2C Retail Benchmark Report of the first quarter of 2020 dives more into details about the key trends in consumer behavior on retail and brand websites.
Related Report: eCommerce Trends 2020: The 7th Edition
Key Findings of the B2C Retail Benchmark Q1 2020
- The mobile share of traffic consistently exceeded 50% every month in 2019. That means mobile is here to stay.
- Paid search and organic search deliver the highest conversion rates and lowest bounce rates, which proves search is the workhorse of high-intent purchases.
- 42% of consumers mentioned they visit Google first when they have a specific product in mind for purchase, Amazon came in second place with 33%.
- Social peaked in late 2019 taking 8% of all traffic. This is a big milestone and should not be ignored as the best retailers are balancing optimized search and email campaigns with discovery journeys on social.
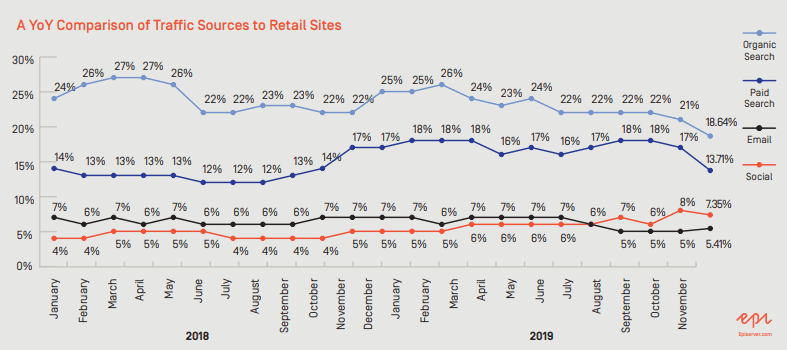
A Figure Shows the YoY Comparison of Retail eCommerce Traffic Sources
Related Report: The Future of Retail 2020 | eMarketer
Average Retail Conversion Rate Benchmark Q1 2020
A high conversion rate is indicative of successful marketing and web design, which means people want what you are offering and they are easily able to get it.
- Since 2017, retailers and brands have invested in mobile optimization, and consumers have gotten more comfortable completing purchases on mobile devices. So, conversion rates have increased from 1.7% on mobile devices to 2.1%
- Direct traffic and referral traffic saw the highest increases in conversion rate year-over-year, while organic search and paid search both saw small declines in conversion rate.
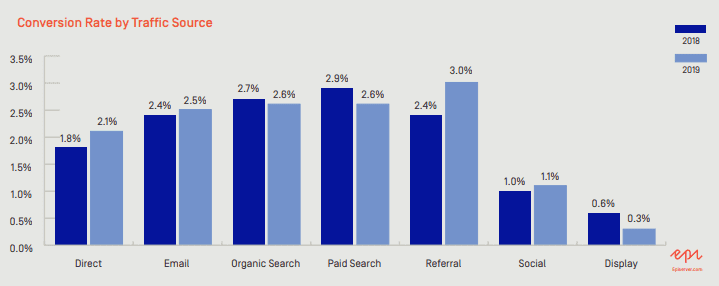
A Figure Shows the Average Retail Conversion Rate by Traffic Source; Q1 2020
Retail Bounce Rate
The chart below shows the monthly retail bounce rate by devices:
- All devices’ bounce rates have hovered around 43%.
- However, the tablet rates were the lowest and the desktop rates were having the highest rates.
- On the other hand, in 2019 the desktop bounce rates dropped lower than the mobile bounce rates.
- Simply, this intimates that people are reaching for their mobile more and more.
- Even though people tend to go for the mobile device option to purchase their goods, serious buyers who are ready to purchase may still rely on their desktop computers for a better digital experience as some mobile sites still lack functionality designed for the smaller screen.
- Comparing summer 2018 to summer 2019. We can see there is a bigger emphasis on July discounting ( to compete with Prime day) could be the reason for lower bounce rates particularly for desktop visits in July.
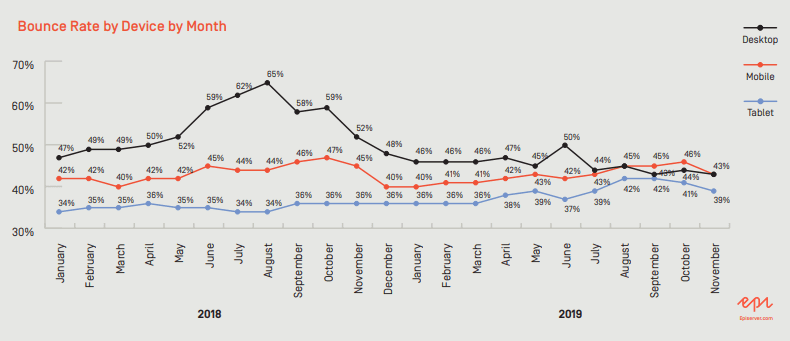
A Figure Shows the Average Monthly Retail Bounce Rate by Device Q1 2020
The Post-Click Experience
The post-click experience is where action and affinity are either won or lost, it can be determined based on the content being presented to the shopper and how relevant the digital experience is to them, personally.
Retailers should bear in mind that they cannot rely on one traffic source to drive new and return customers to their websites because shoppers rarely visit a brand or a retailer’s website for the first time to make a purchase.
The Table of Content of “B2C Retail Benchmark Report, Q1 2020”:
- Executive Summary
- Key Findings
- Traffic Sources
- Sessions by Device
- Conversion Rate by Device
- Conversion Rate by Traffic Source
- Bounce Rate
- The Post-Click Experience
- Methodology
- About Episerver
Number of Pages:
- 11 Pages
Pricing:
- Free
Methodology:
The B2C Retail Benchmark Report, Q1 2020 is based on aggregate data from 160 B2C retail and brand websites using Episerver. The data collected and analyzed is from Jan. 1, 2017 to Nov. 30, 2019, and spans over 4 billion unique website sessions.


