Paid Media Benchmark Report, Q4 2019 | AdStage
Digital Advertising | North America
AdStage has, finally, released its Paid Media Benchmark Report Q3 2019. This is the inaugural report in a quarterly series aimed at benchmarking the key metrics across all social media advertising channels.
This edition of the social media benchmarks report contains key data from over 7.3 billion impressions and almost 80 million clicks powered by the AdStage platform.
Keep reading to gain insights and stats on CPC, CPM, and CTR benchmarks for Facebook, FB Messenger, Instagram, Twitter, LinkedIn, Google Ads, YouTube, Google Display Network, and Microsoft Ads.
Related Reports:
- Paid Media Benchmark Report, Q1 2019 | AdStage
- Paid Media Benchmark Report, Q2 2019 | AdStage
- Paid Media Benchmark Report, Q3 2019 | AdStage
Facebook Ads Benchmarks—Q4 2019
- The median CPC of Facebook ads increased by 42% since Q3 2019 and increased by 15.7% YoY since Q4 2018.
- CPC for Facebook ads shot up to $0.81 in Q4 2019.
- Facebook CPM increased by 9% since Q3 2019 and decreased by 1.6% YoY since Q4 2018.
- Facebook CPM reached $8.87 in Q4 2019.
- The average CTR for Facebook ads decreased by 21% since Q3 2019 and decreased by 13% YoY since Q4 2018.
- The average CTR for Facebook is 1.14% in Q4 2019.
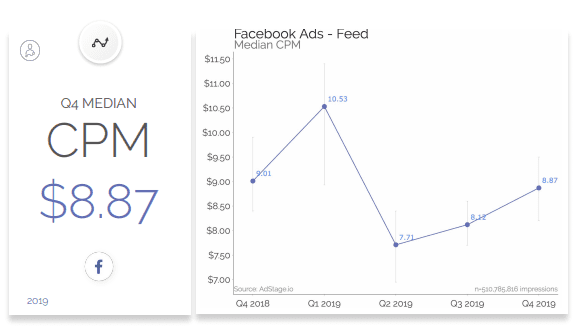
Facebook CPM Q4 2019
Related Report: 2019 Social Media Benchmark Report | Rival IQ
Instagram Benchmark—Q4 2019
- Instagram CPC increased by 84% since Q3 2019 and decreased by 29% YoY since Q4 2018.
- The median Instagram CPC costs $1.53 in Q4 2019.
- The average Instagram CPM decreased by 1.5% since Q3 2019 and decreased by 29.6% YoY since Q4 2018.
- Instagram CPM decreased to reach $6.81 in Q4 2019.
- The average CTR for Instagram Ads decreased by 47.6% since Q3 2019 and CTR decreased by 6.4% YoY since Q4 2018.
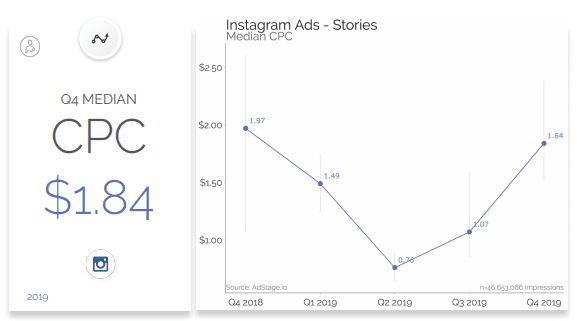
Instagram CPC Q4 2019
Related Reports:
- Instagram Marketing Trends and Benchmarks Report, 2019 | Iconosquare
- The 2019 Instagram Stories Research | Socialinsider
LinkedIn Benchmarks—Q4 2019
- The median LinkedIn CPC reversed course, reporting at $0.58 higher than in Q3 2019.
- LinkedIn ads CPC increased by 16.6% since Q3 2019 and increased by 10.6% YoY since Q4 2018.
- The average LinkedIn CPM increased by 10.3% since Q3 2019 and increased by 16% YoY since Q4 2018.
- The average CTR for LinkedIn ads remained steady since last quarter but dipped slightly YoY from 2018.
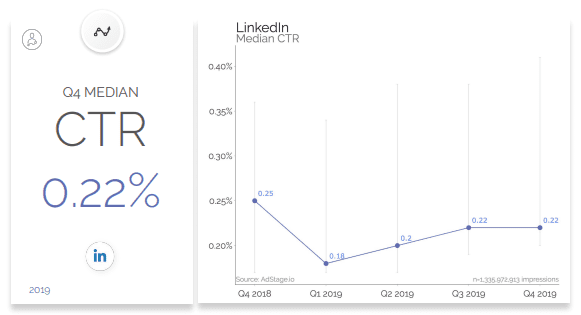
The Average CTR for LinkedIn Ads Q4 2019
Twitter Benchmarks—Q4 2019
- Median Twitter CPC decreased 15 cents from the last quarter and is down 27 cents from where it was the same time last year.
- Median Twitter CPC decreased by 35% since Q3 2019 and decreased by 49% year over year since Q4 2018.
- Median Twitter CPM continued its upward climb Median. It increased by 11.4% since Q3 2019 and increased by 17.5% year over year since Q4 2018.
- Twitter CTR increased by 49.4% since Q3 2019 and increased by 98% year over year since Q4 2018.
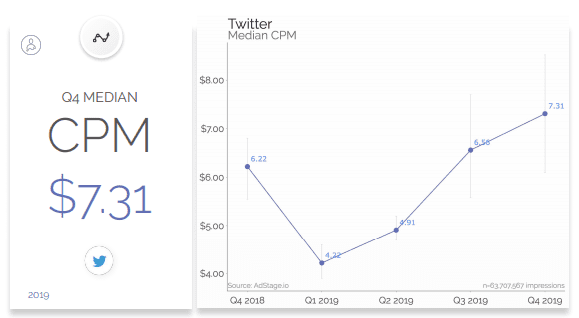
Twitter CPM Q4 2019
Related:
- How to Use Twitter for Business | HubSpot
- The Complete Guide to Direct Response Advertising on Twitter | Nanigans
Google Ads Benchmarks—Q4 2019
- The median CPC for ads on Google Search decrease by 8.5% (11 cents) from last quarter but still remains cheaper than last year down 22.4% (34 cents) year over year.
- The median CPC for Google Display Ads remains the same as last quarter at 0.4 but increased by 11% year over year.
- The median CPM for ads on Google Search plunged $1.43 since last quarter, and is well below the same quarter last year, dropping 35.4%.
- The median CPM for Google Display Ads increased by 28 cents and is down 8 cents YoY.
- In Q4 2019, the median CTR for Google Search Ads increased from 2.35% to 2.50%, while the CTR remains lower than 2019 (down 19% YoY).
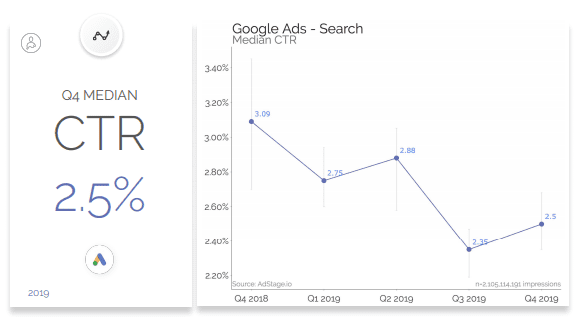
CTR Google Search Ads Q4 2019
Related Report: Amazon Ads Benchmark Report Q3 2019 | Tinuiti
The Content of the “AdStage’s Paid Media Benchmark, Q4, 2019″ Report:
- Introduction
- About Adstage
- Methodology
- Facebook Benchmark:
- News Feed
- Right-Hand Placement
- Marketplace
- Audience Network
- Messenger
- Instagram Benchmark:
- News Feed
- Stories Placement
- Linkedin Benchmark
- Twitter Benchmark
- Google Ads Benchmark
- Search
- Display Network
- Youtube Benchmark
- Microsoft Advertising
- Trends
- Insights
Number of Pages:
- 69 Pages
Pricing:
- Free
Methodology:
Benchmark metrics of the fourth-quarter 2019 are representative of AdStage clients who utilize their products to manage and report on advertising accounts in the North American region.
AdStage made no claims that its social media benchmarks metrics are indicators of a network’s performance at large. Customers’ ad accounts that meet certain spend and activity thresholds are aggregated and summarized to produce median values across its client population.
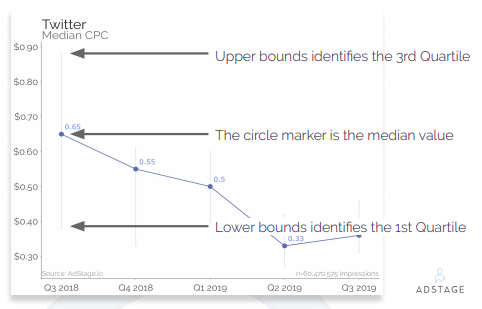
A Figure Shows How to Read the Report’s Charts

